Note - from June 24th 2009, this blog has migrated from Blogger to a self-hosted version. Click here to go straight there.
Housekeeping
I've changed the layout so that only the current day's blatherings appear on the main page; that's a precursor to trying to put a Printer-friendly button onto each little bit of blather.
The problem with that, is that I hate it when tables get chopped in half. I won't put a printer version in place until I can get it to work properly - a page break before each table might work but then I would have to place my variable-length waffling under the table.
There will also be an uptick in the graphical (chart) content of posts soon; it might make the posts themselves longer, or I might break the whole thing up into several chunks so that folks who like to print things out (like me) can print out the bits that interest them rather than the whole lot.
Doubtless I will stuff up the chart-inclusion for the first few goes...
Federal Reserve Open Market Operations
The Fed's OMO desk did two decent-sized repurchases last night -
- a $5.75 billion overnight with $5.599 billion in Treasury-backed collateral; and
- a $10 billion 14-day with $9.121 billion in T-backed.
With all that short-term liquidity sloshing in there ought to have been a tradeable move starting at midnight our time (and remember, the Midnight Moonshot is not conditional on liquidity drained from the system - that is, expiring repurchase agreements).
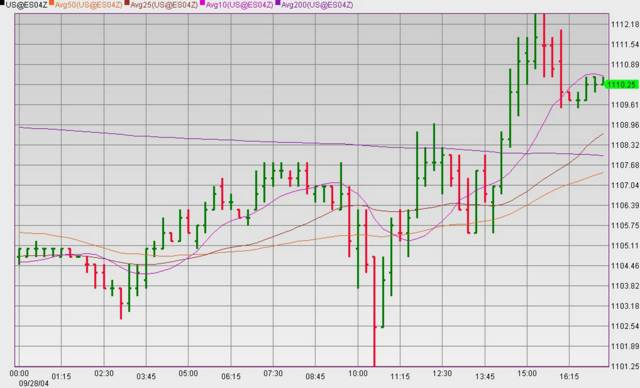
And lo, it came to pass yet again. The early low was set just before 12:01 at 1109.50 (basis the S&P futures December contract), and was touched again at 12:09; in between those two times the market had one attempt to squirt upwards but stalled after a couple of points. However by 12:21 the market was 4 points above its 12:00 and 12:09 levels.
By 1 a.m. our time it had all been given back and the rest of the session was sideways-to-down, except in the Nasdaq where it was just sideways.
That much liquidity should have provided a larger move; you would expect a bigger bang for that many bucks.
Speaking of expectations, I would also have expected a larger proportion of the repurchases to be in Agency-backed and Mortgage-backed collateral, since buyer-of-dud-mortgages Fannie Mae has been caught cooking its books and has been slammed by about 12% over the last two sessions.
Economic Statistics
At 10:30 our time, data on New Jobless Claims were released and were a little bit worse than expected. The jobless claims numbers rose 16,000 to 350,000 (the market expected 340,000). There may have been some Hurricane Effect in the data - that's a given with 4 hurricanes in a month (and another three on the way - all of which are expected to peter out before they Potter Florida).
At Midnight our time the Conference Board's Leading Economic Indicator (LEI) was released.
I have said often - the index doesn't actually lead anything - it is a marketing device more than a sensible economic statistic.
Its components were selected by back-fitting it to economic numbers - so it "leads" history nicely. Whoopee doo, if the process is not properly estimated. And boy, was it ever not properly structured! It ignores all sorts of multiple simultaneous-endogeneities and also ignores the orders of integration of the variables involved. For example, the stock market and money supply are I(1) but with different long-run growth rates; yield spreads, the factory work week and vendor performance are I(0). And those are just some of the variables.
It was built by a process which would get a second-year Econometrics student a FAIL.
Still, Americans - particularly those working in the financial services sector - are more interested in what something's called as opposed to whether it fulfils its purported role.
It's happening here now too. John Howard managed to find one or two journalists stupid enough for them to call him "honest John" in print, so now most make-believe conservatives are stupid enough to believe that he didn't lie his little monkey ass off in order to kiss Bush's equally-simian hindparts - ostensibly for a "Free Trade Agreement" which has negligible benefit for Australia (1% of GDP is the high end of forecast benefits - and that's only after 10 years... that does not even get outside the one-year-ahead forecasting error for any model I've seen - and I've seen them all).
Oh - back to the LEI... it fell by 0.3% which is as was expected by the consensus guess.
Tomorrow's economic data releases include -
Durable Goods orders at 10:30 p.m. our time - the consensus guess is for the series to be unchanged; and
Existing Home Sales at midnight our time - the consensus guess is for a 1% fall to a 6.65million annual rate.
Major US Indices
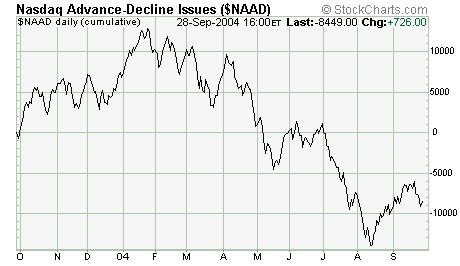
The equity markets didn't really give the early bounce that I was expecting based on the whacky breadth and sentiment data yesterday (particularly the put-call ratio and advance-decline numbers).
Stocks benefited again from a pretty concerted effort to prevent a more serious decline; there was a particularly strong move up from the mid-session lows, which looked like an attempt to get some short-cvering happening. It didn't work and the markets closed close to their lows of the day.
After the close of the cash market, the futures softened a little, and all closed lower than the cash indices.
Before the market opened, some dill downgraded ExxonMobil - which is in the Dow - as part of a broader downgrade of the entire oil sector. The dill in question was from KrautBank (Deutsche Bank), which is no longer properly Kraut anyway (otherwise they would be more systematic and less wankerish).
That is a bet against oil prices by any other name. It's a more sensible bet now, than it was at the time of my 2002 SuperTrade (when Oil - one of the long legs - was at just over $19), but oil's got higher to go unless the abiotic oil hypothesis gets some intellectual bodyguards.
Anyhow - we are back to a situation where the "investment" community is listening to "analysts" again. That means that people haven't yet given up, which means that the market will go much lower before it eventually bottoms.
The DJIA lost 70.28 points (0.7%), closing out the day at 10038.9 points; the broaderS&P500 lost 5.2 points (0.47%), finishing the session at 1108.36.
Over at Times Square, the Nasdaq Composite was pretty much unchanged, adding 0.72 points (0.04%), to 1886.43; the larger-cap stocks fared marginally better with the Nasdaq100 adding 1.55 points (0.11%), to end at 1405.77 points.
The broader stock market measures were down: the NYSE Composite Index lost 27.13 points (0.41%), closing at 6521.43, while the broadest measure of US equities, the Wilshire 5000 fell 40.73 points (0.37%), finishing the session at 10820.9
NYSE Volume was moderate, with 1.29 billion shares crossing the tape, while Nasdaq Volume was below average, with 1.39 billion shares traded.
| Index | Close | Gain(Loss) | % |
| DJIA | 10038.9 | -70.28 | -0.7% |
| S&P500 | 1108.36 | -5.2 | -0.47% |
| Nasdaq Composite | 1886.43 | 0.72 | 0.04% |
| Nasdaq100 | 1405.77 | 1.55 | 0.11% |
| NYSE Composite | 6521.43 | -27.13 | -0.41% |
| Wilshire 5000 | 10820.9 | -40.73 | -0.37% |
| NYSE Volume | 1.29bn | - | - |
| Nasdaq Volume | 1.39bn | - | - |
| US 30-yr yld | 4.8% | 0.02% | 0.46% |
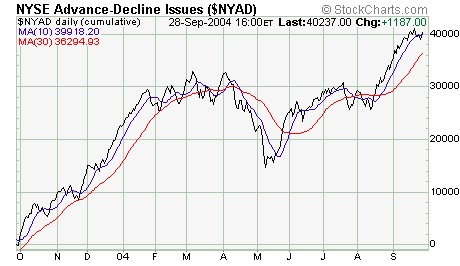
Market Breadth & Internals
On the NYSE the advance-decline numbers came back into line after yesterday's oddball reading. Declining Issues exceeded advancers by 1791 to 1485, for a single-day A/D reading of -306; Nasdaq losers beat gainers by 1605 to 1403.
Declining volume dominated trade on the NYSE by a little under 2:1; declining volume was 827.2 million shares as compared with 427.77 million shares in advancing issues. Nasdaq volume was a bit more evenly split, with advancing volume exceeding volume in decliners by 401.14 to 355.9 million shares.
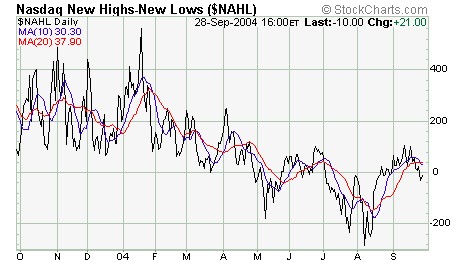
58 NYSE-listed stocks rose to new 52-week highs, and 18 posted fresh 52-week lows, while on the Nasdaq there were 36 stocks that hit new 52-week highs, and 38 which fell to fresh 52-week lows.
| NYSE | Nasdaq |
| Advancers | 1485 | 1403 |
| Decliners | 1791 | 1605 |
| Advancing Volume (m) | 427.77 | 401.14 |
| Declining Volume (m) | 827.2 | 355.9 |
| New Highs | 58 | 36 |
| New Lows | 18 | 38 |
Market Sentiment
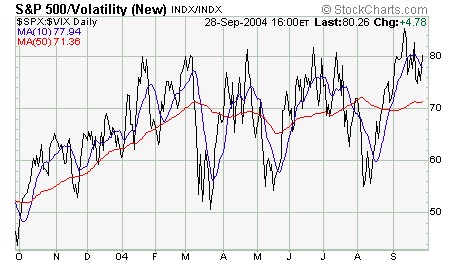
The Dow has dropped 200 points in two sessions, and still volatility has not changed much (more to the point, it is still at excessively low levels). At 14.8, the VIX is still indicative of complacency.
The one-day put-call ratio is still loitering in the vicinty of 1, which as I mentioned yesterday is among the contrarian's toolbox of potential bounce indicators.
| Index | Close | Gain(Loss) | % |
| Equity Call Volume | 1.53m | -0.37m | -19.46% |
| Equity Put Volume | 1.5m | -0.39m | -20.51% |
| CBOE Volatility Index | 14.8 | 0.06 | 0.41% |
| CBOE Nasdaq Volatility Index | 21.17 | 0.11 | 0.52% |
Bonds
Bonds fell along the curve, with the benchmark US 30-yr yld rising 0.022 points to 4.799%. More interestingly, the spread between 10-year bond yields and 3-month bill yields is low enough to be a preliminary recession warning indicator. An inverted yield curve almost makes a recession guaranteed, but a 3m-10yr spread under 2.5% is, it turns out, as good a predictor when taken in concert with some other stuff. I have 13 indices that are very very good predictors of recessions, particularly when they all line up (at present they don't).
At present the "other stuff" is mixed but not strong; I think that the bond market is starting to price in a more marked macroeconomic slowdown in the US.
| Index | Close | Gain(Loss) | % |
| UST 2Y (yld) | 2.512 | 0.06 | 2.57% |
| UST 5Y (yld) | 3.296 | 0.044 | 1.35% |
| UST 10Y (yld) | 4.02 | 0.03 | 0.8% |
| UST 30Y (yld) | 4.798 | 0.022 | 0.46% |
The
Banks Index lost 1.02 points (1.04%), closing at 96.75; within the index,
- the Derivative King - JPMorganChase lost $0.39 (0.98%) to close at $39.46; and
- Citigroup lost $0.50 (1.13%) to close at $43.88
The Broker-dealer Index was pretty much unchanged, losing a scant 0.06 points (0.05%) and closing at 125.21; the ticket clippers lined up as follows -
- Merrill Lynch lost $0.50 (0.98%) to close at $50.60
- Morgan Stanley Dean Witter gained $0.80 (1.64%) to close at $49.52
- Goldman Sachs lost $0.32 (0.34%) to close at $93.07
- Lehman Brothers lost $1.01 (1.27%) to close at $78.56
The Philadelphia SOX (Semiconductor) index gained 2.05 points (0.52%), finishing the session at 393.79
- Triquint gained $0.02 (0.5%) to close at $4.03
- Micron Technology gained $0.14 (1.13%) to close at $12.48
- Intel lost $0.04 (0.2%) to close at $20.38
- Altera gained $0.12 (0.59%) to close at $20.30
- JDS Uniphase gained $0.02 (0.59%) to close at $3.43
Gold & Silver
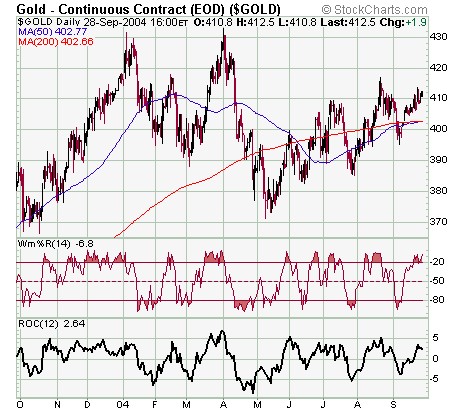
Gold strengthened by $3.1 (0.76%) to $410.60. The technical picture for Gold is actually much more mixed than the Gold Bugs would have you believe. In particular gold shares (by which I mean shares of companies that produce gold... you knew that) are showing topping patterns. Their price action was lethargic as gold itself rec0vered from its pummelling during April-May (which saw gold drop $60 an ounce in a little over a month), but the shares have had a "latecomers' rally" of late and are now (broadly) ahead of Gold.
Although the Gold-HUI ratio is not "too" low yet, I think that Gold investors might have their mettle tested once more yet - and probably with a downdraft of more than $60 in the price of gold. This concords well with the view of some other analysts whose work I have a lot of time for (the link at the top of the page shold give you a clue...)
That doesn't alter my longer-term outlook for Gold; I still think that its price will eventually "cross" the Dow Jones Industrial Average - but it might happen at $600 rather than $4000.
Short equities-long gold is still a decent trade for the next few years - because nobody except the lunatic fringe believes in it yet (whereas Oil as a long-side trade is almost finished for the time being, because merchant banks are hiring oil analysts like there's no tomorrow - and banks are always almost the last money into any market... the dead-last is always retail brokerage clients).
The Gold Bugs Index added 2.48 points (1.16%), finishing the session at 215.72.
Silver rose $0.10 to close at $6.45 per ounce. The Gold and Silver Index (XAU) gained 0.26 points (0.27%), finishing the session at 96.07.
| Index | Close | Gain(Loss) | % |
| Gold | 410.6 | 3.1 | 0.76% |
| Silver | 6.452 | 0.095 | 1.49% |
| PHLX Gold and Silver Index | 96.07 | 0.26 | 0.27% |
| AMEX Gold BUGS Index | 215.72 | 2.48 | 1.16% |
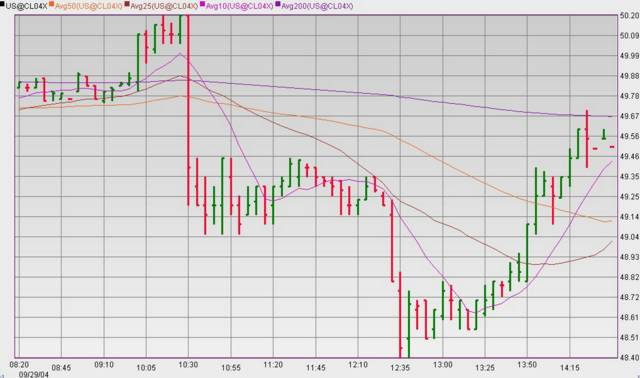
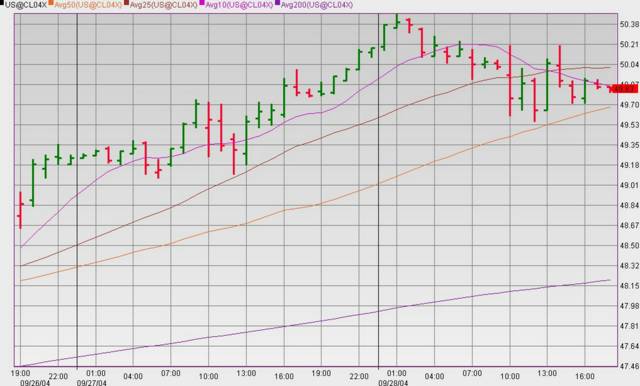
Oil
Although I said above that the "oil trade" is almost over, I really should qualify that; by "almost" I don't mean that it will be sensible to short oil this week. Almost - when banks and other institutions are involved - means "to within about six months".
At one stage I expected Oil to top $65-70 a barrel - now I am not so sure. As Bob Prechter pointed out recently, CNBC has recently added the Oil price to its little "bug" in the corner, alternating it with currency and bond prices. Everybody is talking about the oil market, and how high it could go. That - from my standpoint as an arch-contrarian - is something that should make oil bulls get twitchy sphincters. (Bob Prechter didn't mention sphincters).
Oil was firmer, rising by $0.30 per barrel, closing at $48.20 per barrel; it's now less than one good session from its recent all-time high, and it actually hit $49 before someone with a lot of money stepped right on its neck, driving it down almost $1 from its mid-session high.
Despite newly-resurgent oil prices, the ExxonMobil downgrade helped fuel (get it??? boomboom!!) a decline in the Oil and Gas Index (XOI) which lost 5.71 points (0.83%), to close at 682.72, while the Oil service stocks (OSX) Index lost 0.35 points (0.3%), finishing the session at 118.05 points.
| Index | Close | Gain(Loss) | % |
| Reuters CRB | 280 | 0.75 | 0.27% |
| Crude Oil Light Sweet | 48.2 | 0.3 | 0.63% |
| AMEX Oil Index | 682.72 | -5.71 | -0.83% |
| Oil Service Index | 118.05 | -0.35 | -0.3% |
Currencies
The Aussie Dollar played catch-up with other currencies last night, as most of the European currencies marked time (at least in relation to the US dollar). I read an interesting viewpoint on the USDX (US dollar index) yesterday, which called for a potential rally to the 94 area. That call had two important underpinnings - the first being the technical picture, and the second being that everybody is talking about how shorting the US dollar is an easy trade.
My own view is that eventually the US dollar will be a laughing stock, as it was in the mid-80's when it languished down in the 80-yen range. However that certainly does not preclude the market "catching out" all those holders of USD short positions - remember, the purpose of the market is to take as much money as possible off as many participants as possible.
| Index | Close | Gain(Loss) | % |
| US Dollar Index | 88.62 | -0.08 | -0.09% |
| Euro | 1.2271 | 0.001 | 0.08% |
| Yen | 110.68 | 0.05 | 0.05% |
| Sterling | 1.7976 | 0.0048 | 0.27% |
| Australian Dollar | 0.7133 | 0.01 | 0.92% |
| Swiss Franc | 1.2598 | 0.0005 | 0.04% |
European Markets
A downgrade of Electrolux sucked the life out of the European markets (Oh Boy, I am on FIRE today... with the punning, and the funny-joke-making... and the FLAY-vin).
Electrolux moaned about rising commodity prices and how they would affect margins. The market thought that sucked (boom boom) and tennelled the stock to the tune of 8%.
Rising oil prices were also the focus, but the stock prices of European oil companies were more concerned about the KrautBank downgrade of the entire global oil sector. Royal Dutch/Shell shares fell 2.8% after being downgraded separately by CommerzBank.
France's benchmark CAC-40 Index lost 39.01 points (1.06%), finishing the session at 3653.1; the German DAX-30 Index lost 36.69 points (0.93%), finishing the session at 3905.66; and the UK FTSE-100 Index lost 24 points (0.52%), finishing the session at 4568.3.
| Index | Close | Gain(Loss) | % |
| CAC-40 | 3653.1 | -39.01 | -1.06% |
| DAX-30 | 3905.66 | -36.69 | -0.93% |
| FTSE-100 | 4568.3 | -24 | -0.52% |