Note - from June 24th 2009, this blog has migrated from Blogger to a self-hosted version. Click here to go straight there.
On the weekend, I surmised that the rally which took place last week, might have sufficient legs to keep forging higher - simply because most people didn't think it would.
How things change in a session. Sentiment has rebounded too fast; although the indices have not yet reached overbought levels on oscillators (such as %R, a smoothed version of which is my favourite indicator), the herd is buying calls a bit too fast.
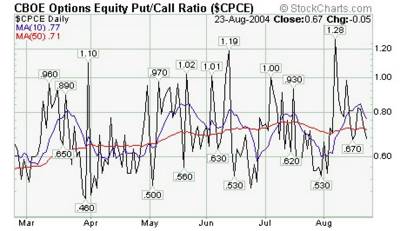
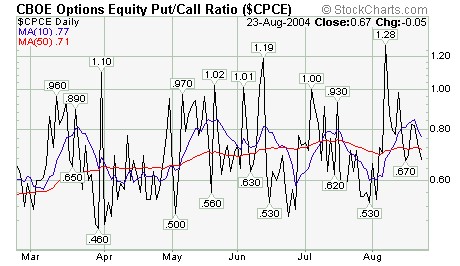
The most up-to-date sentiment indicator that can be accessed is the put-call ratio (PCR)- how many puts were traded during the session, versus the number of calls. It is another sentiment indicator that should be viewed with a contraian slant; once the "nuffies" start buying more puts than calls, you can almost guarantee that the market is close to making a swing low. Contrariwise, when the nuffies think "I'll ride this new bull market, and by crikey I'll do it withsome leverage", and start buying loads of calls, a top is in sight.
It is not a "no brainer" though; the option-buying community - like the share-trading public more generally - tend to be concentrated in calls. As a result, the "equilibrium" level of the Put-call ratio is about 0.8. that means that about 25% greater volume is traded in calls.
When Put volume rises - because nuffnuffs get frightened as the market screams into the red - and overtakes call volume, it is pretty much time to change bias to "buying".
That's the only way to use sentiment indicators - or at least it's the only way I use them. When the sentiment indicators hit an extreme (either bullish or bearish) I try t change my trading focus to the opposite direction.
So when the PCR exceeds 1, I will not take any intraday shorting signals. l switch to a "buying bias" and wait for intraday oversold levels (I mostly use an 85-tick chart with a smoothed %R) and use intraday overbought levels to exit. When the PCR drops below about 0.7 I do the reverse.
It's also instructive to see just how often a spike in the PCR precedes a "divergence" in other indicators; it's not unusual to get a spike in the PCR, followed by another couple of hours of almost "abandon all hope" selling which takes the indices to new lows but does not take oscillators to new lows. That is another tell-tale sign of an impending reversal.
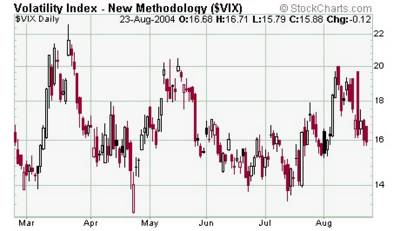
 The VIX - which measures the implied volatility of front-month index options over the S&P - is another useful measure of sentiment. When implied volatility rises, it means that the options market is "pricing in" a greater possibiity of a steep decline. Puts and calls are revalued upwards.
Again, this is a contrarian indicator. Recently it has fallen mind-blowingly fast (although it often does that immeidately after expiration), and is now back at a level which has always indicated complacency.
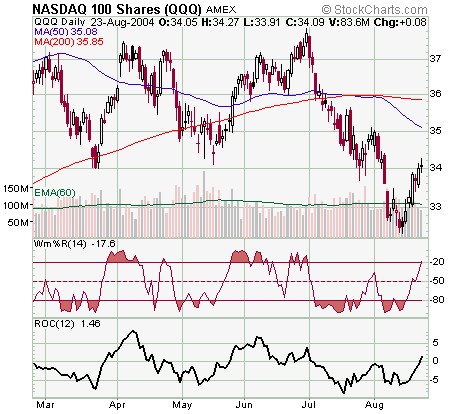
It seems unlikely that the market could snap back so hard from its deeply oversold condition, and yet fail to either hit its 50-day moving average or even hit overbought on a "raw" %R oscillator (leave aside my smoothed version). I can't fathom it, but from tonight on my trading discipline requires that I move to a selling bias.
| Index | Close | Gain(Loss) | % |
| Dow Jones Industrial Average | 10073.05 | -37.09 | -0.37% |
| S&P500 Index | 1095.68 | -2.67 | -0.24% |
| Nasdaq Composite | 1838.7 | 0.68 | 0.04% |
| Nasdaq100 Index | 1370.9 | 4.17 | 0.31% |
| NYSE Composite | 6385.44 | -29.23 | -0.46% |
| Wilshire Total Market Index | 10631.83 | -33.5 | -0.31% |
| NYSE Volume | 1.02b | - | - |
| Nasdaq Volume | 1.22b | - | - |
| US 30-year bond yield | 5.07% | 0.04% | 0.82% |
| Index | Close | Gain(Loss) | % |
| CAC-40 | 3589.69 | 51.67 | 1.46% |
| DAX-30 | 3772.14 | 59.53 | 1.6% |
| FTSE-100 | 4405.3 | 36.1 | 0.83% |

 The VIX - which measures the implied volatility of front-month index options over the S&P - is another useful measure of sentiment. When implied volatility rises, it means that the options market is "pricing in" a greater possibiity of a steep decline. Puts and calls are revalued upwards.