
Note - from June 24th 2009, this blog has migrated from Blogger to a self-hosted version. Click here to go straight there.
Monday's Pivots (US Market)
| Dow | S&P500 | Nasdaq | Bonds | |
| R2 | 10592 | 1192.83 | 1571 | 113 11/32 |
| R1 | 10562 | 1187.87 | 1563.5 | 112 28/32 |
| Pivot | 10513 | 1179.83 | 1550.5 | 112 9/32 |
| S1 | 10483 | 1174.87 | 1543 | 111 26/32 |
| S2 | 10434 | 1166.83 | 1530 | 111 7/32 |
Economic Statistics
Some important numbers out last night - by and large the results were nothing to get excited about.- Retail Sales grew by a lacklustre 0.2%, but were still enough to beat the "guess", which called for growth of 0.1%;
- Retail Sales excl. Autos were reported, with the number at 0.9%, which exceeded the consensus guess (0.5%).
Business Inventories grew by 0.1%, a slower pace than the forecast of 0.5%; much of this can be arttributed to the sharp drawdown in inventories at vehicle dealerships, which is associated with end-of-model "runouts".
The preliminary estimate of the University of Michigan Consumer Sentiment was reported at 95.5, as compared with expectations of 93.
Since this survey - like most of the sentiment surveys (ISM/NAPM, Beige Book, and so on) show near-zero correlation with any meaningful economic indicator, it's not clear to me why anybody bothers when the stupid thing is released.
It's yet anther triumph of marketing - every major economy has some group of charlatans who relase their own versions of these pointless, meaningless numbers, attempting to cash in on the multitude of survey based datapoints generated by self-promoting US groups.
It seems that it works so long as you call something a "leading indicator" and curve-fit the historical weights (so that the historical fit looks sexy - any data series can be made to fit near-perfectly given enough jiggering). Then you can sell it to dimwits who have no real idea how it was created... they just know it fits history (because you showed them it did) and it's called a leading indicator.
Here's a forward-looking leading indicator, which I have prepared using my favourite BLARCH estimator, where I pull numbers out of various orifices until I find one that I like... the US is screwed. As screwed as any Latin American tinpot-junta-dominated regime. As doomed as Rome, Carthage or any of the other crowds from history who thought that it was remotely efficient to try and bully your way to resource-control.
Sure, the statistical authorities can generate buckets of numbers - it gives economists something to talk about. The Soviet Union used to produce masses of production statistics, too... every plan met its target, and socialism was being "scientifically proven" to out-produce captialism.
The US is trying to pull the same stunt - trying to prove that military-crony-capitalism (with some genuine elements of national socialism) - can outproduce genuine laissez-faire capitalism. Well, it can't, sorry.
But I digress...
Federal Reserve Open Market Operations
The Fed's Open Market Operations desk performed 1 repurchase operation last night:
- a $8.5billion, 4-day repurchase, entirely transacted in Treasury-backed collateral .
The Fed has pumped buckets of dough into the market recently - much more than is required to offset expiring repurchases. They know full well that the short-term (intraday) markets rely on repurchase money in order to generate low-risk short-squeezes, and they are willing providers. To see the rest of the world's verdict on this blatant socialism-of-the-markets, look at where the US dollar is heading.
Major US Indices
It seems like only 2 weeks ago that the market was under 10,000 and looking fairly ordinary. Last night - after a bit of an effort - the Dow broke 10500.
This will bring out the sell-side spruikers faster than a rotten carcass will bring blowflies, and to about hte same effect (intellectually). The "trend" of the last couple of weeks will be taken and projected into the future (with a sexy electronic ruler though, not the old-fashioned plastic job).
For now, everything is just as ebullient as 1999/2000 - in fact, even more so (after all, in 2000 the US economy looked in moderately good shape; they were not shelling out (ha ha) $2 billion a week (minimum) on foreign adventures to give their Monkey-in-Chief a hard-on (interns are cheaper). The budget was in "surplus" (yes, I know it was a pretend surplus, but it remains that even that pretend, "pro forma" budget has revered by a trillion dollars) and was projected to stay that way.
Clearly, the market is not paying any attention to the economy. It's not paying any attention to the goepolitical situation. It's not paying any attention to valuation. It's a momentum market - which is fine so long as everyone understands that - but there is an entire industry whose livelihoods rely on convincing the poor 401(k) schlub that this is "The Real Thing". That industry doesn't face any genuine censure or penalty if the information they provide turns out to be crap and the aforementioned schlub's 401(k) becomes a 200.5(k) as a result of a halveing of the market.
(If they did face censure, Abby Joseph Cohen would be in Guantanomo Bay)
For the session, the DJIA advanced 69.17 points (0.66%), closing out the day at 10539.01 points, which was pretty much the high tick for the day.
The broader S&P500 gained 10.69 points (0.91%), closing at 1184.17. Techs were on fire again, with the Nasdaq Composite adding 24.07 points (1.17%), to close at 2085.34, while larger-cap technology issues weren't quite as ebullient - the Nasdaq100 added only 16.71 points (1.08%), to end at 1558.41 points.
NYSE Volume was chunky, with 1.54 billion shares crossing the tape, while Nasdaq Volume was super-chunky (over 2 bill), with 2 billion shares traded.
| Index | Close | Gain(Loss) | % |
| DJIA | 10539.01 | 69.17 | 0.66% |
| S&P500 | 1184.17 | 10.69 | 0.91% |
| Nasdaq Composite | 2085.34 | 24.07 | 1.17% |
| Nasdaq100 | 1558.41 | 16.71 | 1.08% |
| NYSE Volume | 1.54bn | - | - |
| Nasdaq Volume | 2bn | - | - |
| US 30-yr yld | 4.91% | -0.05% | -1.07% |
Market Breadth & Internals
On the NYSE advancing Issues exceeded decliners by 2484 to 845 for a single-day A/D reading of 1639; Nasdaq gainers trumped losers by 1886 to 1168.
Honestly, the A/D line is getting as silly as the volatility numbers. There was a time when a single-day A/D reading of 1200 was a reasonable indicator that the rally was getting silly. I still think that's the case, but the market continues to confound.
NYSE advancing volume exceeded volume in decliners by 1180.4 to 336.39 million shares; Nasdaq advancing volume was greater than volume in decliners by 858.58 to 266.42 million shares.
374 NYSE-listed stocks rose to new 52-week highs, and 10 posted fresh 52-week lows, while on the Nasdaq there were 205 stocks that hit new 52-week highs, and 28 which fell to fresh 52-week lows
| NYSE | Nasdaq | |
| Advancers | 2484 | 1886 |
| Decliners | 845 | 1168 |
| Advancing Volume (m) | 1180.4 | 858.58 |
| Declining Volume (m) | 336.39 | 266.42 |
| New Highs | 374 | 205 |
| New Lows | 10 | 28 |
Market Sentiment
Same old same old. Sentiment looks like the entire market has discovered crack cocaine. There are still enough puts being bought to indicate that the market could be squeezed yet higher (about a week ago - when the market got through 1140-ish - I mentioned that there was a potential upside target of 1220, but I never seriously expect it to get there).
Notice the reverse Head & Shoulders on the chart below - it's usually a pretty reliable chart pattern - but then again the massive head & shoulders on the longer-term charts (which projects down to the low 500s for the S&P) has not played out fully yet, so there is a tension between the intermediate-term and the long-term.

S&P, Daily - with intermediate-term reverse H&S
But also look how desperately overbought the market is - both the %R and the ROC are at levels which have always led to significant pullbacks.It's still the case, therefore, that puts represent the higher-probability "bet" - but as I mentioned above, this thing seems determined to defy gravity. Later today the various investor surveys are released - I hope to have something reasonably comprehensive on them (and the Commitment of Traders reports) before the end of the weekend.
Those QQQ $38 puts (QQQ WL) continue to feel the wrath of a raging uptrend - they fell to a paltry $15 last night (having been purchased for $50 on Monday night). The second put (of a two lot) over the Lehman 20-yr Treasury iShares (TLT WK) also pulled back as a result of the big bounce in the bond market, with TLT WK falling back $55 to $130 (but still way above the purchase price of $70).
| Index | Close | Gain(Loss) | % |
| CBOE Equity Call Volume (000) | 855.43 | 135.4 | 18.8% |
| CBOE Equity Put Volume (000) | 538.21 | 147.4 | 37.72% |
| CBOE Volatility Index | 13.33 | 0.29 | 2.22% |
| CBOE Nasdaq Volatility Index | 18.82 | -0.1 | -0.53% |
| Equity Put-Call Ratio | 0.63 | 0.09 | 15.92% |
| 10-day PCR | 0.59 | 0.0029 | 0.5% |
| SPX-VIX Ratio | 88.83 | -1.16 | -1.28% |
Bonds
Bonds rose at the long end, with the yield on the benchmark 30-year Treasury bond shedding 5.3 points to 4.912%.
| Index | Close | Gain(Loss) | % |
| UST 2Y (yld) | 2.817 | -0.02 | -0.6% |
| UST 5Y (yld) | 3.512 | -0.043 | -1.21% |
| UST 10Y (yld) | 4.186 | -0.09 | -2.04% |
| UST 30Y (yld) | 4.902 | -0.064 | -1.29% |
The Banks Index advanced 0.74 points (0.72%), to end the session at 103.73; within the index,
- the Derivative King - JPMorganChase shed $0.01 (0.03%) closing at $39.17; and
- Citigroup posted a rise of $0.80 (1.73%) ending the day at $47.06
The Broker-dealer Index rose 2.54 points (1.78%), closing at 145.46; the ticket clippers lined up as follows -
- Merrill Lynch posted a rise of $0.98 (1.75%) ending the day at $56.95
- Morgan Stanley Dean Witter added $0.98 (1.88%) to end the session at $53.13
- Goldman Sachs gained $1.66 (1.61%) at $104.66
- Lehman Brothers advanced $0.08 (0.1%) closing at $84.00
The Philadelphia SOX (Semiconductor) index advanced 9.55 points (2.31%), ending the day at 423.81
- Triquint rose $0.04 (1%) at $4.04
- Micron Technology posted a rise of $0.35 (3%) ending the day at $12.00
- Intel gained $0.52 (2.24%) closing at $23.69
- Altera gained $0.63 (2.81%) ending the day at $23.05
- JDS Uniphase dipped $0.02 (0.63%) at $3.15
Gold & Silver
Gold strengthened by $3.80 (0.87%) to $438.50 per ounce, and its intraasession high was $439.50. The Gold Bugs Index gained 4.62 points (1.95%), at 241.86 points.
Silver rose $0.16 (2.08%) to close at $7.62 per ounce. The Gold and Silver Index (XAU) gained 2.59 points (2.44%), to end the session at 108.59 points.
| Index | Close | Gain(Loss) | % |
| Gold | 438.5 | 3.8 | 0.87% |
| Silver | 7.615 | 0.155 | 2.08% |
| PHLX Gold and Silver Index | 108.59 | 2.59 | 2.44% |
| AMEX Gold BUGS Index | 241.86 | 4.62 | 1.95% |
Oil
Oil stabilised, closing the day with a drop of just $0.01 per barrel at $47.42 per barrel. The Oil and Gas Index (XOI) advanced 11.8 points (1.68%), to end the session at 713.76.
The Oil service stocks (OSX) Index added 2.92 points (2.51%), to 119.2
| Index | Close | Gain(Loss) | % |
| Reuters CRB | 280.75 | -2.5 | -0.88% |
| Crude Oil Light Sweet | 47.42 | -0.01 | -0.02% |
| AMEX Oil Index | 713.76 | 11.8 | 1.68% |
| Oil Service Index | 119.2 | 2.92 | 2.51% |
Currencies
The US dollar index took a minor pasting, and continues an apparently-inexorable path down towards the (now critical) 82 level flagged a month ago in this space. I still favour a bounce in this instrument before a further decline past 82, 80 and other key levels. The US's status as global moocher-of-the-century has been getting wider and wider airplay, and it's pretty clear that Russia and China are quite keen to see it taken down a peg.
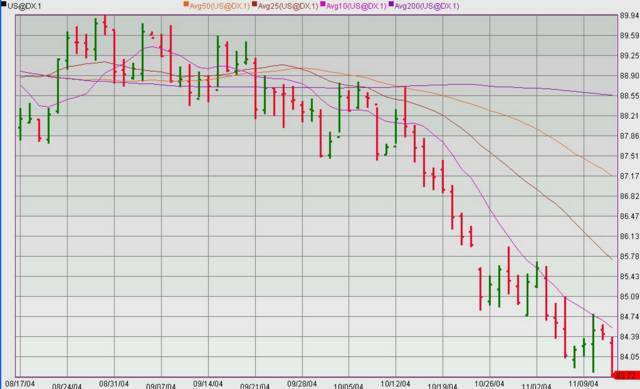
USDX, Daily - Ugly, or What?
| Index | Close | Gain(Loss) | % |
| US Dollar Index | 83.72 | -0.62 | -0.74% |
| Euro | 1.2973 | 0.0067 | 0.52% |
| Yen | 105.55 | -1.01 | -0.95% |
| Sterling | 1.8568 | 0.0146 | 0.79% |
| Australian Dollar | 0.769 | 0.0041 | 0.54% |
| Swiss Franc | 1.1716 | -0.0058 | -0.49% |
| Canadian Dollar | 0.8385 | 0.0025 | 0.3% |
European Markets
France's benchmark CAC-40 Index rose 1.32 points (0.03%), ending the day at 3835.11; The German DAX-30 Index gained 12.54 points (0.3%), closing at 4143.35; and in the UK, the FTSE-100 Index rose 17 points (0.36%), to 4793.9 points.
| Index | Close | Gain(Loss) | % |
| CAC-40 | 3835.11 | 1.32 | 0.03% |
| DAX-30 | 4143.35 | 12.54 | 0.3% |
| FTSE-100 | 4793.9 | 17 | 0.36% |