Note - from June 24th 2009, this blog has migrated from Blogger to a self-hosted version. Click here to go straight there.
The Dow Jones Industrial Average gained 69.32 points (0.69%), closing out the day at 10110.14 points; the broader S&P500 Index gained 7.12 points (0.65%), finishing the session at 1098.35. Over at Times Square, the Nasdaq Composite gained 18.13 points (1%), to close at 1838.02, while the larger-cap stocks fared better with the Nasdaq100 Index adding 13.49 points (1%), to end at 1366.73 points.
The broader stock market measures lagged the blue-chip Dow: NYSE Composite Index gained 42.04 points (0.66%), closing at 6414.67.
NYSE Volume was about average, with 1.2 billion shares crossing the tape, while Nasdaq Volume was about average, with 1.35 billion shares traded.
Bonds fell at the long end, with the benchmark US 30-year bond yield rising 0.006 points to 5.029%.
The
Banks Index gained 0.86 points (0.89%), finishing the session at 97.66; within the index,
- the Derivative King - JPMorganChase gained $0.65 (1.71%) to close at $38.65; and
- Citigroup gained $0.49 (1.08%) to close at $45.95
The Broker-dealer Index gained 2.32 points (1.89%), finishing the session at 124.9; the ticket clippers lined up as follows -
- Merrill Lynch gained $0.80 (1.57%) to close at $51.87
- Morgan Stanley Dean Witter gained $0.75 (1.51%) to close at $50.30
- Goldman Sachs gained $1.21 (1.4%) to close at $87.81
- Lehman Brothers gained $0.65 (0.9%) to close at $73.14
The mighty mighty SOX (Semiconductor) index gained 0.87 points (0.23%), finishing the session at 386
- Triquint gained $0.06 (1.43%) to close at $4.25
- Micron Technology gained $0.49 (4.27%) to close at $11.96
- Intel lost $0.39 (1.77%) to close at $21.62
- Altera lost $0.10 (0.48%) to close at $20.60
- JDS Uniphase gained $0.04 (1.27%) to close at $3.20
Other indices popular with the beta-chasers were up, with the
- Biotech Index up 8.84 points (1.82%), finishing the session at 494.28
- the Hi-Tech Index ahead 4.95 points (1.19%), finishing the session at 422.14
Gold weakened by $1.00 (0.00%), and Gold Lease Rates were lower which contributed to the Gold Bugs Index adding 4.28 points (2.09%), finishing the session at 209.49 while the Gold and Silver Index (XAU), which contains more hedgers, gained 1.8 points (1.91%), finishing the session at 95.82.
Oil lost ground late in the session, after a spike to $49.40 a barrel early on. this gave some fuel to the Oil and Gas Index (XOI) which gained 3.14 points (0.5%), finishing the session at 629.54, while the Oil service stocks (OSX) Index gained 2.66 points (2.55%), finishing the session at 107.08.
Defensives were firm with the Cyclicals (CYC) Index adding 6.22 points (0.93%), finishing the session at 678.03, while the Consumer (CMR) Index gained 4.36 points (0.79%), finishing the session at 553.99.
France's benchmark CAC-40 Index lost 6.4 points (0.18%), finishing the session at 3538.02, while in the UK, the FTSE-100 Index gained 6.6 points (0.15%), finishing the session at 4369.2
The technical picture for US equities has become a little less dire than it had been over the past couple of weeks; the prospects for a continuation of last week's bounce appear about 50/50, and here's a stab at explaiing why:

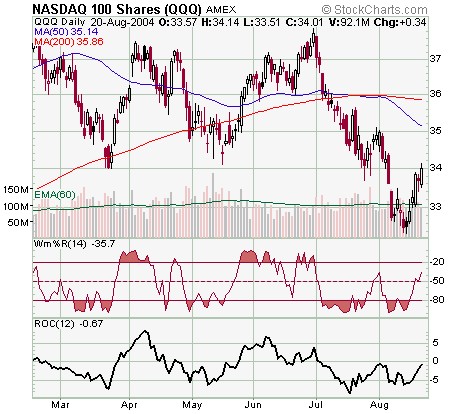
Take a look at the chart of the QQQ. It's pretty easy to tell that the recent rally was primarily caused by two things: firstly the "washing off" of a deep oversold condition which was also accompanied by a "divergence" whereby price made a lower swing low, but oscillators such as %R and ROC did not. Second was options expiration (last Friday).
The thing about options expiration is that "da Boyz" will always manipulate the market in such a way as to ensure that most options expire worthless. By "most" I mean the largest possible proportion of open interest.
Think about that for a second: if the market is driven too far down, then put options at each successively lower "strike" move into the money; if the market moves too far up, then call options at progressively higher prices do likewise.
So the aim of the "game" at and around expiration is to position the market so that both call and put buyers lose as much as possible. If you get it right, you cause the largest amount of hurt.
That is called the "MaxPain" level, and for last Friday's expiration it was any price between $34 and $35 on the QQQ (QQQ options have strikes at each whole dollar). Note what that means: all put options with strike prices of $34 or below expire worthless, and all call options with strike prices above $35 do likewise.
And whaddya know - after a month-long decline that looked like it would never stop (which resulted in most call options being worth a pittance as of the Friday before expiration), the market rallied pretty much all week and made its high for the week with half an hour to go on Friday... at $34.14.
I think of option-writers as being the embodiment of evil.
Lots of folks who understand constrained maximisation are happy with the idea that a genuinely benevolent deity would aim to provide the best of all possible universes. That is, the universe which maximises the present value of (Good - Evil) {note... that is "Good MINUS Evil"}.
You've got to bear in mind that generally that is not the same as the universe that provides zero evil. It is probably not the universe that contains the maximum amount of good, either.
In the options universe, however, the major writers want the opposite. they want to sell the punters as large a volume of options at the highest possible prices, and then drive the largest possible amount of those options to worthlessness before expiration.
But I digress....
The key thing is "where to from here?"
Post-Expiration Continuation, Or Reversal Back Down?
I'm going to concentrate on the QQQ for the moment, because I have the chart on hand, plus it's easy to get data for almost everything it contains.
On the chart at the top, it's pretty easy to see that the QQQ bounced from a pretty deep oversold condition. For the purposes of the chart, "oversold" means that the %R and ROC indicators are jointly below key levels> In my own work I prefer to use a moving average of %R - which can't be shown on the chart above - to improve the signal-to-noise ratio. I also use a higher threshold [90 rather than 80] to avoid false signals).
At present, the "raw" %R has not bounced all the way to overbought, but it sure drove up hard during the past week.
It's not a huge surprise that markets bounced when they did. Bear in mind that in the week prior to last week we had a confluence (or even a concatenation) of circumstances which was like a day in the life of Job. In seven days we had CSCO and HPQ give the market very reason to sell; oil prices continued to climb as Iraq, Venezuela, YUKOS and northern Africa (Sudan) all contributed negatively to supply expectations. Venezuela resolved itself last weekend without descent into chaos (but note that oil did not decline for the week... but it is massively overbought and when YUKOS assets are released this week oil will drop hard).
QQQ is still solidly below its 200-day moving average, and its 50-day MA has crossed below its 200-day. Pretty much everything aligns with the bear case.
The QQQ (and the index that it replicates, the Nasdaq100) led the market on the way down; it topped out before the Dow or the S&P, and broke its 200-day MA before either of the other two benchmarks.
The "easy" option would be to favour a bounce to the 50-day MA; that would pretty much drive the "Cubes" to an overbought situation, and it really only has to get to the mid-$34 range to meet the 50-day. A "kiss" off that level, followed by a plunge, is pretty much what everyone expects.
And of course, everyone is wrong - otherwise everyone would be rich, and no economic system can support universal affluence.
To do this job properly you need to consider several things apart from the technical basics (the position of the market relative to its key moving averages and oscillators).
For me, the additional data mostly concerns market breadth, and the key guideposts include:
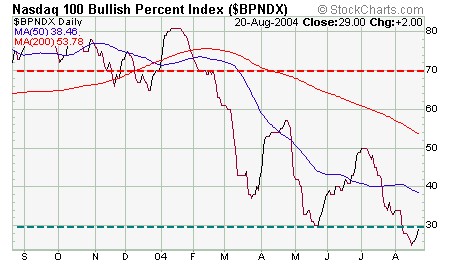
the "Bullish Percent Index" situation (this is really quite important, and I suggest you familiarise yourself with the term and what it means, by clicking on the link);
Option volatility for the index in question;
the current options configuration (less important right now, since Monday is the start of a brand new front month - I am not including that in this week's discussion).
First, the Bullish Percent Index.

The key thing about the BPI is that it is an indicator that works best as a contrarian indicator when it gets to extremes.
When 75-80% of stocks in the Nasdaq100 are showing "bullish" point-and-figure setups, the dumb money is on the market equivalent of the Charge of the Light Brigade. Likewise, when only 20-30% of stocks are doing so, the herd has sold the low.
Think of the herd as being similar to government: you just know that the drought is over when you get every state Premier sitting around a table pontificating about how we should all put a brick in the dunny. In fact, when government gets too interested in the "dire water catchment situation" you should start thinking about building an Ark - especially if your name is Noah.
The BPI shows a sentiment extreme; the Nasdaq100 reached a point of extreme pessimism. On the assumption that the market exists to imflict the maximum financial damage on the idiots of the world, it is showing a solid BUY signal based on this indicator alone.
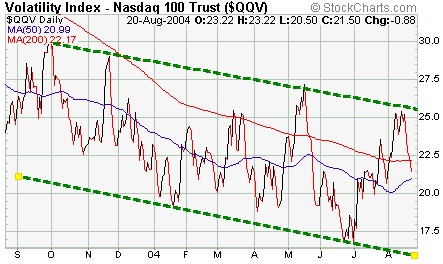
Option Volatility - the QQV
Notice that the recent decline (i.e., prior to last week) took the QQQ option volatility index right back to the top of a (downward sloping) trend channel. In the ordinary course of events, that would presage a reversal (volatility down usually means "market up") and we got that last week.
The question is whether or not the QQV descends all the way back down to the bottom of the channel. If that were to eventuate, the market would exceed the June/July high within a month.
So with QQV and the NDX BPI both showing pretty unambiguous (contrarian) indications, it is actually quite likely that the QQQ continues to rally, at least for the early part of the week.
The absolute key will be the behaviour of the oil market. I have it on some authority that Russian regulators will release the lien on YUKOS' assets (although my information was that it was supposed to have happened last week... bzzzzt.). That, plus the amelioration of electoral disputes in Venezuela, should put downward pressure on oil prices.