
Note - from June 24th 2009, this blog has migrated from Blogger to a self-hosted version. Click here to go straight there.
Federal Reserve Open Market Operations
Another miserly contribution by the central wankers today; the OMO desk did a paltry $3.25 billion, overnight repurchase. Only $2.399 billion was in Treasury-backed collateral, which is less than half of the notional $5 bill required to give the market a decent push.
Not enough repo always equals... no Midnight Moonshot.
Economic Statistics
It was a pretty data-rich day. Mortgage Purchase Applications, Corporate Profits, and GDP were all released before the market opened.
The only number anybody cared about, though, was the Petroleum Status Report released by the Energy Information Administration. That number was released at 10:30 a.m. NY time, and was the excuse for the market to leave behind the morning lows for good (for the session).
The report showed that crude oil inventories rose for the week by 3.4 million barrels. The market had braced itself for another drawdown - recent weeks have seen drawdowns of 7-12 millon barrels.
The result of the number was a snap downwards in oil prices by $1 in 5 minutes - and another snap downwards exactly one hour later by another $80c in ten minutes. Another little lesson for the Johnny-Come-Latelies in the oil trading game; when the market gets blindsided by a datapoint, it can be as illiquid as an OTCBB tech stock.
Check out a 5-minute chart of Crude:
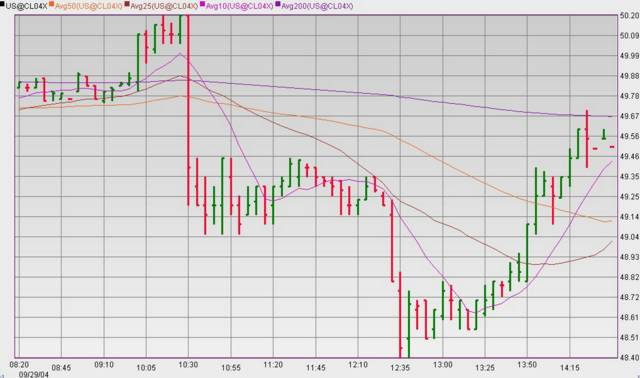
Oil's Wild Ride
Oil aside, the rest of the data could be classified as "good but not great".
Mortgage Purchase Applications rose 2.9% for the week, with refinancing applications rising a whopping 7.7%. With mortgage rates slightly softer - down to 5.7% - the "pass the ticking parcel" game continues to be played by people who don't know what they're doing.
Corporate Profits were reported at a staggering 19.5% above last year's level (basis NIPA post-tax corporate operating profits), but only 1.6% from the prior quarter. The whole shebang only amounted to $717 billion (annualised).
GDP grew slightly faster than expected: 3.3% annualised versus a 3.0% cosensus guess. This was the third instalment of the same number (Q2 of 2004). They call this the "Final" number, but in a few years - once revisions are no longer being watched for this number - they will revise away most of it. The GDP deflator - the price component - met consensus expectations with a rise of 3.2%.
Almost all of these numbers were old-ish news, and the futures market gave a very muted reaction to them.
Major US Indices
Caterpillar rose another 4.8% today, on the heels of yesterday's rise. Recall that yesterday CAT had offered some mid-session musings about how great business was going to be for the quarter.
Boeing was a drag on teh Dow, losing 2.5% as it was downgraded by some dill somewhere.
All things considered, it was an interesting session - the market is again under the spell of the oil price, and any downtick in the price of crude results in a return to "Happy-Happy-Happy...Joy-Joy-Joy" world...which is fine if you're Stimson J Cat, but not sensible if you're trying to claw your way to a financially-secure retirement.
Speaking of Crude, it recovered manfully from its nuffie-thrashing downdraft immediately after the inventories report... but nobody was watching it.
The DJIA gained 58.84 points (0.58%), closing out the day at 10136.24 points; the broader S&P500 gained 4.74 points (0.43%), finishing the session at 1114.8.
There was a bit of a meltup in Semiconductors which helped the tech market outperform the rest. The Nasdaq Composite gained 24.07 points (1.29%), to close at 1893.94, while the larger-cap stocks fared better with the Nasdaq100 adding 21.16 points (1.52%), to end at 1410.86 points.
The broader stock market measures rose: the NYSE Composite Index gained 17.29 points (0.26%), closing at 6560.68, while the broadest measure of US equities, the Wilshire 5000 posted a gain of 52.47 points (0.48%), finishing the session at 10885.89
NYSE Volume was solid, with 1.41 billion shares crossing the tape, whileNasdaq Volume was slightly above average, with 1.64 billion shares traded.
| Index | Close | Gain(Loss) | % |
| DJIA | 10136.24 | 58.84 | 0.58% |
| S&P500 | 1114.8 | 4.74 | 0.43% |
| Nasdaq Composite | 1893.94 | 24.07 | 1.29% |
| Nasdaq100 | 1410.86 | 21.16 | 1.52% |
| NYSE Composite | 6560.68 | 17.29 | 0.26% |
| Wilshire 5000 | 10885.89 | 52.47 | 0.48% |
| NYSE Volume | 1.41bn | - | - |
| Nasdaq Volume | 1.64bn | - | - |
| US 30-yr yld | 4.86% | 0.06% | 1.25% |
Market Breadth & Internals
On the NYSE advancing issues exceeded decliners by 1820 to 1471, yielding a single-day A/D reading of 349; Nasdaq gainers outpaced losers by 2020 to 997. That's a little more measured than either of the previous two days.
NYSE volume was tilted to the stocks that gained for the session, but not overwhelmingly so. Advancing volume scored 841.69 million shares, while registered 546.86 million shares; Nasdaq advancing volume outpaced volume in decliners by 3:1, 663.01 to 220.37 million shares.
133 NYSE-listed stocks rose to new 52-week highs, and 18 posted fresh 52-week lows, while on the Nasdaq there were 71 stocks that hit new 52-week highs, and 41 which fell to fresh 52-week lows.
| NYSE | Nasdaq | |
| Advancers | 1820 | 2020 |
| Decliners | 1471 | 997 |
| Advancing Volume (m) | 841.69 | 663.01 |
| Declining Volume (m) | 546.86 | 220.37 |
| New Highs | 133 | 71 |
| New Lows | 18 | 41 |
Market Sentiment
If volatility falls any further, option writers wil be giving calls away. It is really getting silly: if my data is correct then today's close in the VIX is the lowest close for the volatility measure since January 31, 1996.
The SPX-VIX ratio is back above 80 - generally a precursor to a marked market decline.
The single-day Equity Put-Call Ratio rose slightly to 0.82 - still in a zone that gives no clues as to likely market direction.
| Index | Close | Gain(Loss) | % |
| Equity Call Volume | 1.99m | 0.07m | 3.73% |
| Equity Put Volume | 1.64m | 0.09m | 5.62% |
| CBOE Volatility Index | 13.21 | -0.62 | -4.48% |
| CBOE Nasdaq Volatility Index | 20.67 | -0.69 | -3.23% |
Bonds
The slightly faster reported GDP numbers gave the bond market something to think about - particularly the price measures. Although these were in line with expectations, it's pretty clear that inflation is now under-reported... and the bond market knows it.
Bonds fell along the yield curve, with the yield on the benchmark US 30-yr bond rising 6.5 basis points to 4.862%.
| Index | Close | Gain(Loss) | % |
| UST 2Y (yld) | 2.585 | 0.05 | 1.85% |
| UST 5Y (yld) | 3.351 | 0.073 | 2.23% |
| UST 10Y (yld) | 4.089 | 0.08 | 1.97% |
| UST 30Y (yld) | 4.862 | 0.065 | 1.36% |
- the Derivative King - JPMorganChase gained $0.30 (0.76%) to close at $39.68; and
- Citigroup added $0.39 (0.88%) to $44.70
The Broker-dealer Index gained 1.83 points (1.48%), ending the day at 125.68; the ticket clippers lined up as follows -
- Merrill Lynch lost $0.07 (0.14%) to $50.17
- Morgan Stanley Dean Witter rose $0.65 (1.33%) to $49.50
- Goldman Sachs gained $0.22 (0.24%) closing at $93.28
- Lehman Brothers added $1.57 (2%) to finish at $80.19
The Philadelphia SOX (Semiconductor) index gained 6.93 points (1.85%), finishing the session at 380.62
- Triquint gained $0.06 (1.61%) to close at $3.79
- Micron Technology lost $0.04 (0.33%) to close at $12.10
- Intel added $0.39 (1.98%) to close at $20.07
- Altera rose $0.37 (1.96%) to close at $19.29
- JDS Uniphase gained $0.07 (2.15%) to close at $3.32
Gold & Silver
[Commentary]
Gold strengthened by $0.90 (0.22%) to $412.90. The Gold Bugs Index was almost unmoved by the rise in the metal, rising just 0.09 points (0.04%) to close at 223.98 points.
Silver continued a strong recent rally, adding $0.08 (1.23%) to $6.68 per ounce.
The Gold and Silver Index (XAU) shed 0.39 points (0.39%), finishing the session at 99.39 points.
| Index | Close | Gain(Loss) | % |
| Gold | 412.9 | 0.9 | 0.22% |
| Silver | 6.675 | 0.081 | 1.23% |
| PHLX Gold and Silver Index | 99.39 | -0.39 | -0.39% |
| AMEX Gold BUGS Index | 223.98 | 0.09 | 0.04% |
Oil
After some real gyrations during the session, Oil lost ground, shedding $0.33 per barrel, closing at $49.52 per barrel.
The Oil and Gas Index (XOI) dropped 7.51 points (1.07%)to 694.58 while the Oil service stocks (OSX) Index lost 1.84 points (1.51%), finishing the session at 120.09 points.
| Index | Close | Gain(Loss) | % |
| Reuters CRB | 283 | 1 | 0.35% |
| Crude Oil Light Sweet | 49.52 | -0.33 | -0.66% |
| AMEX Oil Index | 694.58 | -7.51 | -1.07% |
| Oil Service Index | 120.09 | -1.84 | -1.51% |
Currencies
[Commentary]
| Index | Close | Gain(Loss) | % |
| US Dollar Index | 88.29 | 0.02 | 0.02% |
| Euro | 1.233 | 0.0014 | 0.11% |
| Yen | 110.85 | -0.46 | -0.41% |
| Sterling | 1.7992 | -0.0134 | -0.74% |
| Australian Dollar | 0.7167 | -0.0010 | -0.11% |
| Swiss Franc | 1.2585 | -0.0015 | -0.12% |
European Markets
France's benchmark CAC-40 Index gained 15.2 points (0.41%), finishing the session at 3682.67; the German DAX-30 Index added 38.09 points (0.98%), ending the day at 3920.36; and in the UK, the FTSE-100 Index edged ahead 20.8 points (0.46%) to close at 4588.1
| Index | Close | Gain(Loss) | % |
| CAC-40 | 3682.67 | 15.2 | 0.41% |
| DAX-30 | 3920.36 | 38.09 | 0.98% |
| FTSE-100 | 4588.1 | 20.8 | 0.46% |