
Note - from June 24th 2009, this blog has migrated from Blogger to a self-hosted version. Click here to go straight there.
MR HOWARD, YOU COWARD - GO ON ROVE LIVE.
Obviously now Howard can't go on Rove Live, because he would be seen to be capitulating to pressure.
Being a typical short man, he views an concessional behaviour as weakness - which actually makes him a very weak personality... I'm talking about Howard, not Rove.
I hope 20-somethings can see this weakness of character - they will generally vote for "progressives" anyway, but it is instructive to see a weak, small-hearted man ducking what could have been a very soft-soap interview.
Federal Reserve Open Market Operations
The Fed had nothing to do with the jamjob that happened last night - contrary to my expectations in yesterday's ramblings, there was no big repurchase... just a bounce generated by the ludicrously lopsided advance-decline and volume numbers from yesterday.
The Fed performed a single 3-day repurchase for a total of $3.25 billion; only 0.583 billion was in Treasury-backed (indicating that the Fed knew that the stock market would look after itself). The rest was in mortgage backed collateral.
Economic Statistics
The only economic number released last night was the Conference Board survey of Consumer Confidence. The number as released at midnight our time, and was softer than expected.
The Current Conditions Index within the survey fell quite hard, which was the principal contributor to an index reading of 96.8 (as compared with a consensus guess of 100). The Future Conditions Index actually edged up but the increase was smaller than a rounding error.
Major US Indices
The little spurt last night was mostly generated by Caterpillar (CAT), who for some reason decided to release a bullish earnings update during the session. The comments by management were extraordinarily upbeat - talk of "unprecedented" growth in sales, with earnings up as much as 80%.
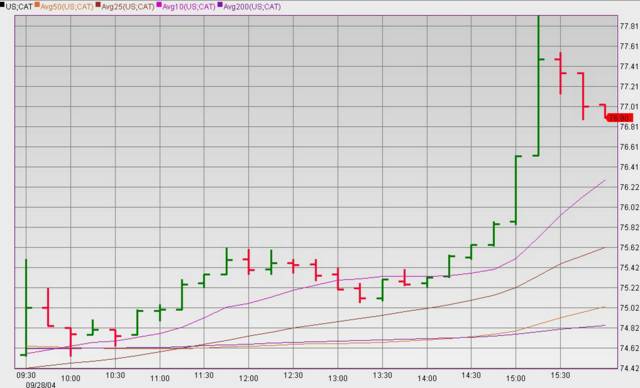
Caterpillar's Moonshot
It's pretty clear from the chart below that the broader market was already in 'bounce mode" when CAT let it's announcement out of the bag (boom boom). Note that the time stamps on the chart below are Chicago time, so the "CAT news" spike happens at 2 p.m. CT rather than 3 p.m. ET... but it's the same time.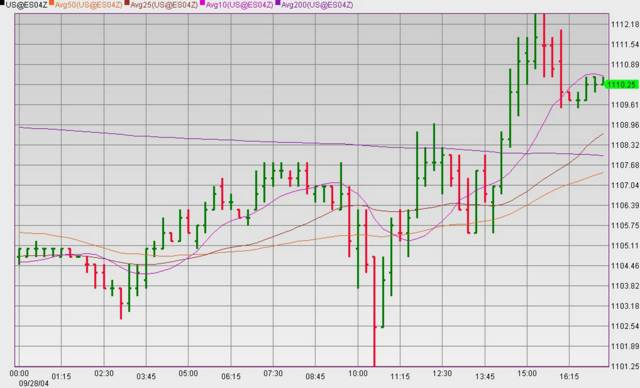
S&P Futures Intraday
The S&P futures tested 1101.25 over an hour after the release of the bad confidence data, but the bears couldn't retain control and drive the index down below 1100. That's to be expected - it took two days to for the Dow 10200 and 3 days to breach 10100 on the way down. Even without the CAT news last night, things were still set up for a bounce back above Dow 10000; the CAT news just gave the afternoon more ofa "short squeeze" flavour.
The DJIA regained the "five figure" level, adding 88.86 points (0.89%), closing out the day at 10077.4 points; the broader S&P500 gained 6.54 points (0.59%), finishing the session at 1110.06.
Over at Times Square, the Nasdaq Composite gained 9.99 points (0.54%), to close at 1869.87, while the larger-cap stocks fared worsewith the Nasdaq100 adding 4.15 points (0.3%), to end at 1389.7 points.
The broader stock market measures lagged the blue-chip Dow: NYSE Composite Index gained 47.02 points (0.72%), closing at 6543.39, while the broadest measure of US equities, the Wilshire 5000 posted a gain of 68.62 points (0.64%), finishing the session at 10833.42
NYSE Volume was pretty solid, with 1.4 billion shares traded, while Nasdaq Volume was about average, with 1.55 billion shares changing hands.
| Index | Close | Gain(Loss) | % |
| DJIA | 10077.4 | 88.86 | 0.89% |
| S&P500 | 1110.06 | 6.54 | 0.59% |
| Nasdaq Composite | 1869.87 | 9.99 | 0.54% |
| Nasdaq100 | 1389.7 | 4.15 | 0.3% |
| NYSE Composite | 6543.39 | 47.02 | 0.72% |
| Wilshire 5000 | 10833.42 | 68.62 | 0.64% |
| NYSE Volume | 1.4bn | - | - |
| Nasdaq Volume | 1.55bn | - | - |
| US 30-yr yld | 4.8% | 0.03% | 0.61% |
Market Breadth & Internals
MArket internals are getting really very head-spin-ish. One day eveything's a diamond, the next day everything's a stone. Last night was as ludicrously tilted to the gainers as the previous night was to losers. That indicates that short-term "hot" money - hedge funds - are the drivers in this market.
On the NYSE advancing issues outpaced decliners by 2269 to 1026 for a single-day A/D reading of 1243; Nasdaq gainers outpaced losers by 1908 to 1148. The Cumulative A/D lines for the two major exchanges tell a story of a divergence which must resolve itself in the direction dictated by valuation - that is, the next major swing will be to the downside.
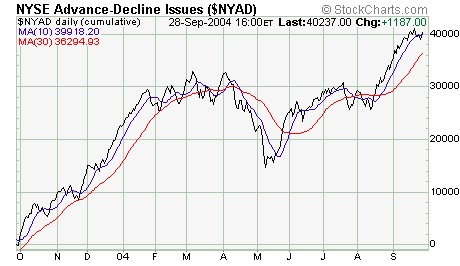
NYSE Cumulative A/D Making New Highs
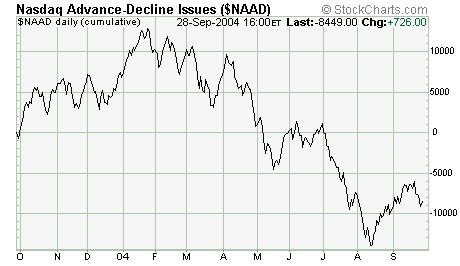
Nasdaq Cumulative A/D Not Nearly as Strong
NYSE advancing volume outpaced volume in decliners by over 2:1, with 960.04 million shares traded in stocks that gained for the session as compared with 418.69 million shares in losers; Nasdaq volume was more evenly divided with advancing volume shading volume in decliners by 452.77 to 394.51 million shares.
154 NYSE-listed stocks rose to new 52-week highs, and 35 posted fresh 52-week lows, while on the Nasdaq there were 55 stocks that hit new 52-week highs, and 62 which fell to fresh 52-week lows
Of particular interest is the shape of the chart of the New Highs - Ne Lows for the Nasdaq; it has been unimpressive all year and has never really given any indication that a "washout" was in progress.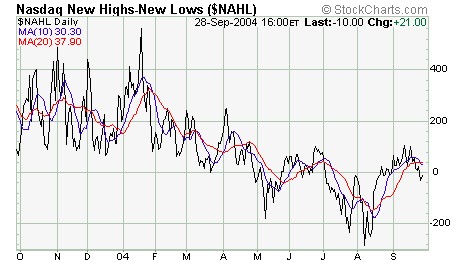
More New Lows than Highs on Nasdaq
| NYSE | Nasdaq | |
| Advancers | 2269 | 1908 |
| Decliners | 1026 | 1148 |
| Advancing Volume (m) | 960.04 | 452.77 |
| Declining Volume (m) | 418.69 | 394.51 |
| New Highs | 154 | 55 |
| New Lows | 35 | 62 |
Market Sentiment
Sentiment indicators continue to tell a story of a market that nobody thinks will fall.
It's all very well for pundits to crap on about Presidential Cycles - a "no brainer" since you have to have no brains to believe it. There's also the shorter-term "Buy Rosh Hashana, Sell Yom Kippur" mantra that always accompanies the Days of Awe. But eventually the tide goes out - and as Warren Buffet once famously said, that's when you find out who's swimming naked.
The VIX is mind-bogglingly low - both in absolute terms and relative to the level of the S&P500. The Put-Call ratio is falling - albeit not to levels that are particularly interesting.
It is almost as if the market is sending a strong message that it will not go anywhere until after the election; that means it does not want to go up after the election - otherwise that would be the path of least resistance at the moment. As we saw in 2000, a Repubican victory is not necessarily a harbinger of market delights; we are in a generational bear market and anyone who tells you otherwise is trying to sell you something.
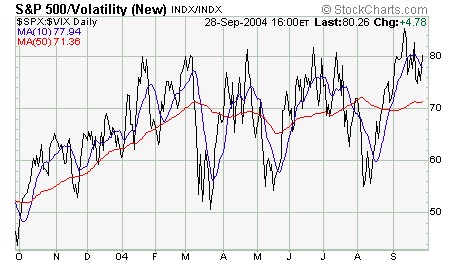
SPX-VIX Ratio at Crash Levels
| Index | Close | Gain(Loss) | % |
| Equity Call Volume | 1.92m | 0.15m | 8.49% |
| Equity Put Volume | 1.55m | 0.11m | 7.36% |
| CBOE Volatility Index | 13.83 | -0.79 | -5.4% |
| CBOE Nasdaq Volatility Index | 21.36 | -0.56 | -2.55% |
Bonds
Despite the rather downbeat confidence numbers, bonds fell at the long end of the maturity spectrum, with the yield on the benchmark US 30-yr bond rising 2.9 basis points to 4.801%. the 3-month to 5-year strip was a different story, with yields falling up to 5 basis points.| Index | Close | Gain(Loss) | % |
| UST 2Y (yld) | 2.504 | -0.04 | -1.49% |
| UST 5Y (yld) | 3.263 | -0.016 | -0.49% |
| UST 10Y (yld) | 4.002 | 0.01 | 0.18% |
| UST 30Y (yld) | 4.801 | 0.029 | 0.4% |
- the Derivative King - JPMorganChase gained $0.25 (0.64%) to $39.38; and
- Citigroup gained $0.70 (1.61%) to close at $44.31
The Broker-dealer Index gained 0.66 points (0.54%), finishing the session at 123.85; the ticket clippers lined up as follows -
- Merrill Lynch gained $0.36 (0.72%) to $50.24
- Morgan Stanley Dean Witter gained $0.08 (0.16%) closing at $48.85
- Goldman Sachs gained $0.31 (0.33%) to close at $93.06
- Lehman Brothers gained $0.44 (0.56%) to $78.62
The Philadelphia SOX (Semiconductor) index lost 3.27 points (0.87%), finishing the session at 373.69
- Triquint lost $0.02 (0.53%) to $3.73
- Micron Technology lost $0.18 (1.46%) to close at $12.14
- Intel lost $0.24 (1.2%) finishing at $19.68
- Altera lost $0.09 (0.47%) to $18.92
- JDS Uniphase lost $0.03 (0.91%) closing at $3.25
Gold & Silver
Gold's chart is at a pretty interesting juncture; it is overbought - although not desperately so - but has failed to exceed its previous swing high.
Now my "Elliotteering" ranks with only the enthusiastic amateurs, but what I see on the chart below is a big ol' fashioned double top - and after that a series of waves that have resulted in a lower high. I am still of the view that the mettle of Gold investors and speculators will be tested one more time before a rise to new historic highs. this will involve a downdraught that will take Gold back below $350 and possibly even below $300 - just to screw latecomers. (Of course is you bought gold when I said to - January 30th, 2002 - you could ride that downdraft and giggle all the way).
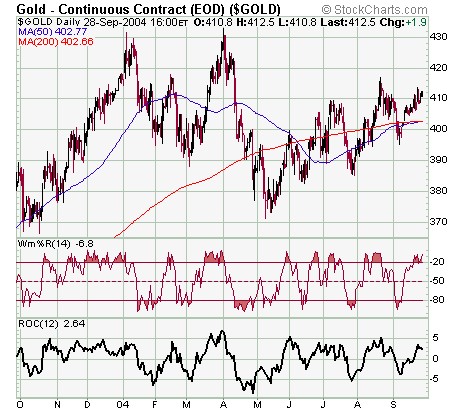
Gold - Setting Up a Failure?
For today however, Gold strengthened by $3.50 (0.86%) to $412 an ounce, which contributed to the Gold Bugs Index adding 7.87 points (3.64%) to 223.89 points.
Silver rose $0.06 (0.96%) to close at $6.59 per ounce. The Gold and Silver Index (XAU) gained 3.07 points (3.17%), finishing the session at 99.78
| Index | Close | Gain(Loss) | % |
| Gold | 412 | 3.5 | 0.86% |
| Silver | 6.594 | 0.063 | 0.96% |
| PHLX Gold and Silver Index | 99.78 | 3.07 | 3.17% |
| AMEX Gold BUGS Index | 223.89 | 7.87 | 3.64% |
Oil
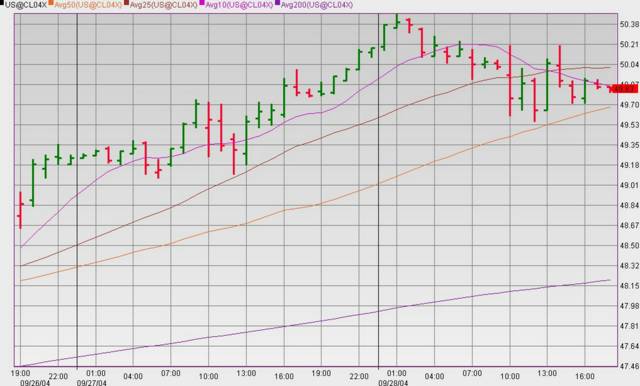
Oil tops $50
Oil hit $50 as I was typing last night, and rose as high as $50.47 on ACCESS last night. It softened late in the session, and for the session rose by just $0.08 per barrel, closing at $49.90 per barrel. The Oil and Gas Index (XOI) gained 11.17 points (1.62%) to 702.09 while the Oil service stocks (OSX) Index gained 2.12 points (1.77%), finishing the session at 121.93.
| Index | Close | Gain(Loss) | % |
| Reuters CRB | 282 | 0.25 | 0.09% |
| Crude Oil Light Sweet | 49.9 | 0.08 | 0.16% |
| AMEX Oil Index | 702.09 | 11.17 | 1.62% |
| Oil Service Index | 121.93 | 2.12 | 1.77% |
Currencies
The Australian dollar was again in the van last night, rising 0.6% against a broadly weaker US dollar. Yet again, Yen support - probably by the Bank of Japan - is the only source of succour for a US dolalr that is trying to hold up under the burden of massive external imbalances and fiscal mismanagement of monumental proportions.
| Index | Close | Gain(Loss) | % |
| US Dollar Index | 88.27 | -0.21 | -0.24% |
| Euro | 1.2323 | 0.0026 | 0.21% |
| Yen | 111.35 | 0.11 | 0.1% |
| Sterling | 1.8129 | 0.0039 | 0.22% |
| Australian Dollar | 0.7177 | 0.0043 | 0.6% |
| Swiss Franc | 1.2586 | -0.0021 | -0.17% |
European Markets
Does anybody care what happened in Europe? I don't - although I am genuinely Europhile (my Europhilian is for culture and stuff rather than their economic dynamism).
Basically Europe gets head-faked or drop-faked by the US market all the time, except for the one day a month when Euro-zone news actualyl drives the market.
France's benchmark CAC-40 Index gained 10.54 points (0.29%), finishing the session at 3667.47; the German DAX-30 Index gained 7.9 points (0.2%), finishing the session at 3882.2; and in the UK, the FTSE-100 Index gained 26.1 points (0.57%), finishing the session at 4567.3
| Index | Close | Gain(Loss) | % |
| CAC-40 | 3667.47 | 10.54 | 0.29% |
| DAX-30 | 3882.27 | 7.9 | 0.2% |
| FTSE-100 | 4567.3 | 26.1 | 0.57% |